Edge Ingestion
Field readings enter through a dedicated device-facing boundary.
Telemetry Platform
Field telemetry routed into alerts and an operations dashboard.
The context
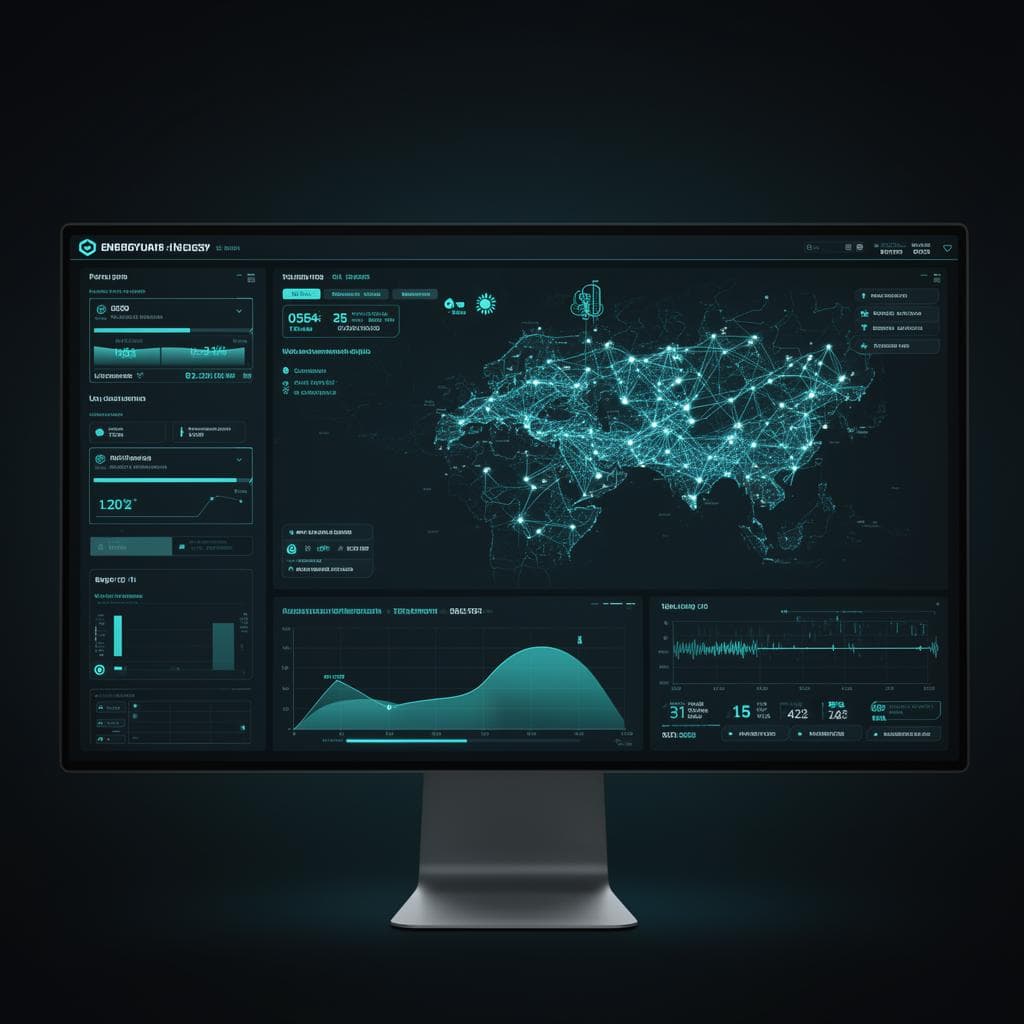
ShedSense demonstrates the software path between distributed field equipment and an operator: readings enter through a telemetry boundary, pass through processing and rules, and become status, alerts and a reviewable incident history.
The problem
Teams monitoring equipment in the field needed a clear way to turn incoming meter readings into information they could act on.
Key requirements
What Rodent built
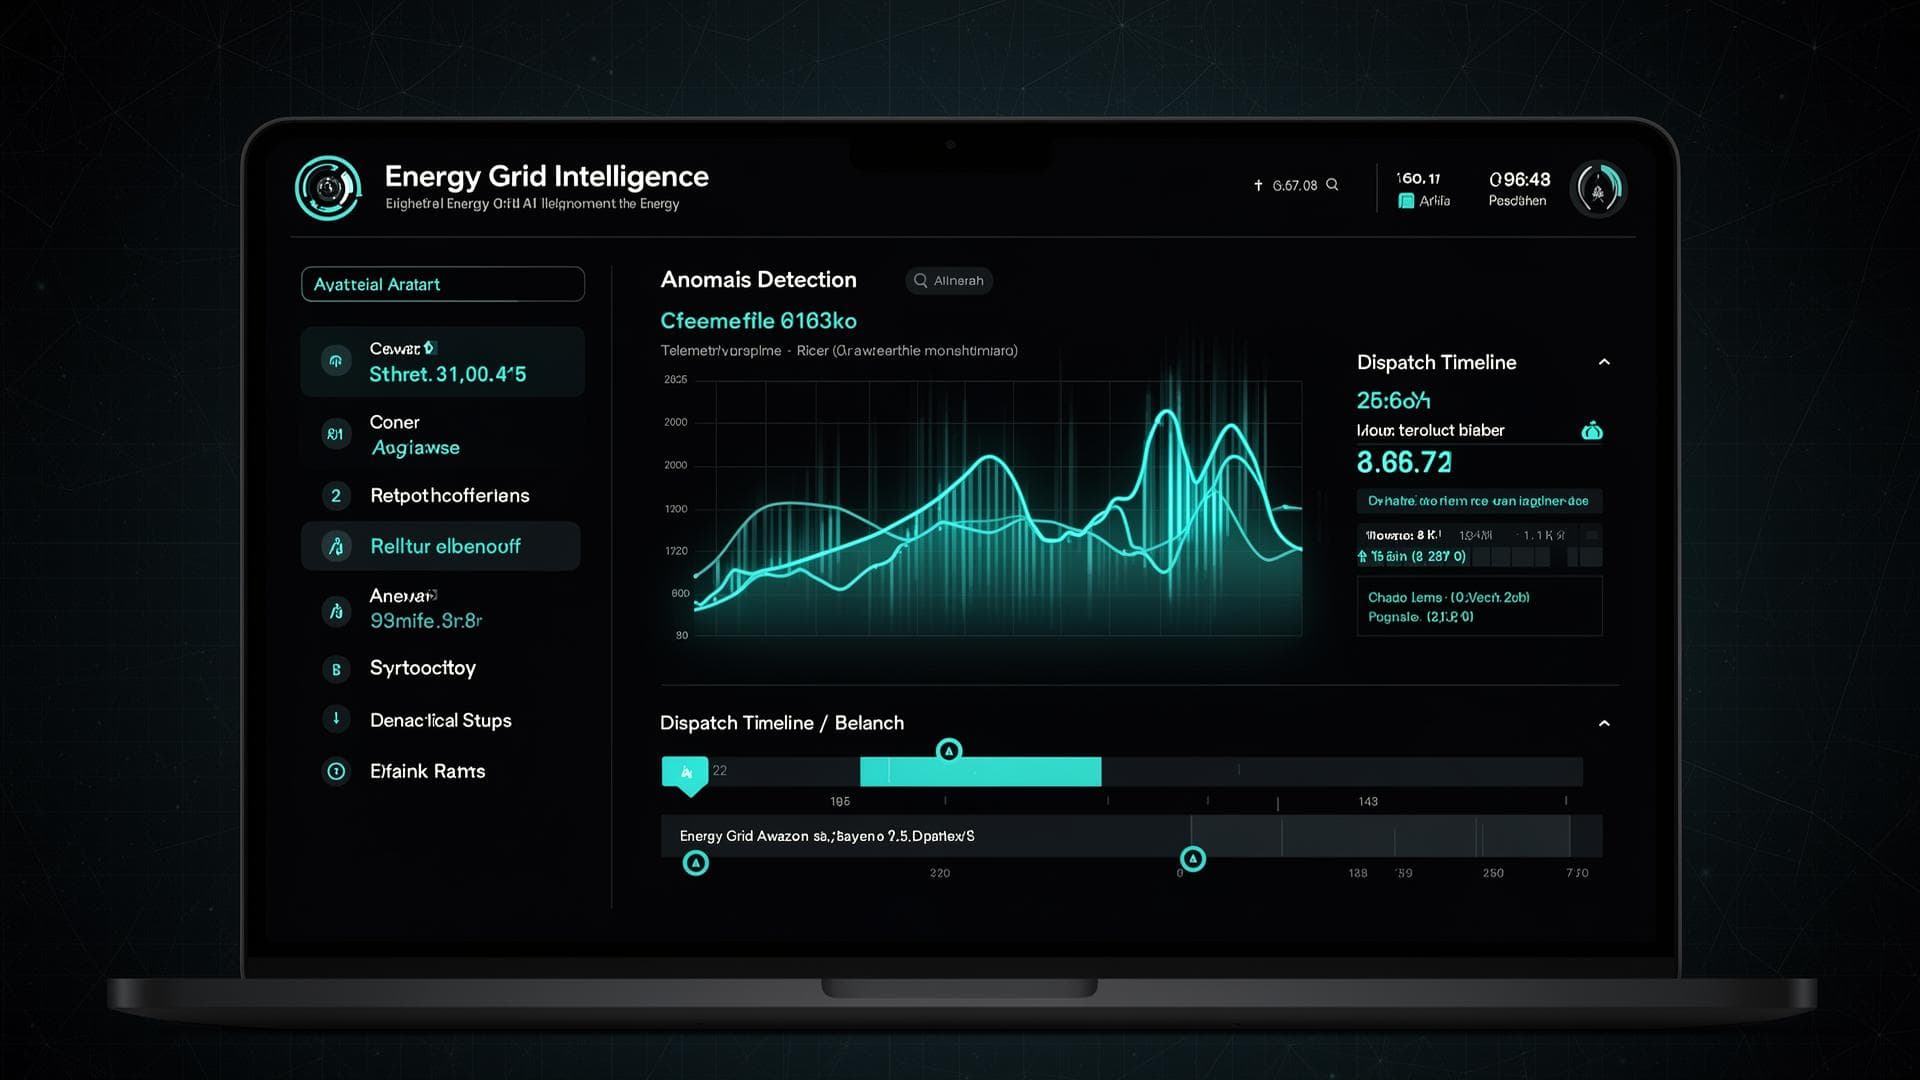
Rodent built a telemetry flow that receives readings through MQTT, checks them against rules, and sends alerts and status updates to an operations dashboard.
Capabilities delivered
Field readings enter through a dedicated device-facing boundary.
Messages move from equipment into the processing flow through an IoT-oriented protocol.
Defined conditions convert readings into operational events.
Relevant events are surfaced for operator attention.
Operators can view equipment state and event context away from the device layer.
Time-ordered events support review and reconstruction of what occurred.
System architecture
Data / process flow
Engineering decisions
Device messages enter a processing layer instead of being coupled directly to the operator dashboard.
Explicit rules translate telemetry into operator-relevant status and alerts.
Ordered events preserve enough context to inspect what happened after an alert.
Engineering challenges
Telemetry intake is isolated from the interface so either layer can evolve without becoming the other’s transport.
Readings and derived events retain sequence so operators can reconstruct an incident rather than see only the latest state.
The architecture acknowledges that field messages and user interfaces do not always share a continuous connection.
Technology in context
Technology supports the product’s interfaces, data and release path. It is part of the engineering explanation, not the outcome itself.
Operational interface
Outcome
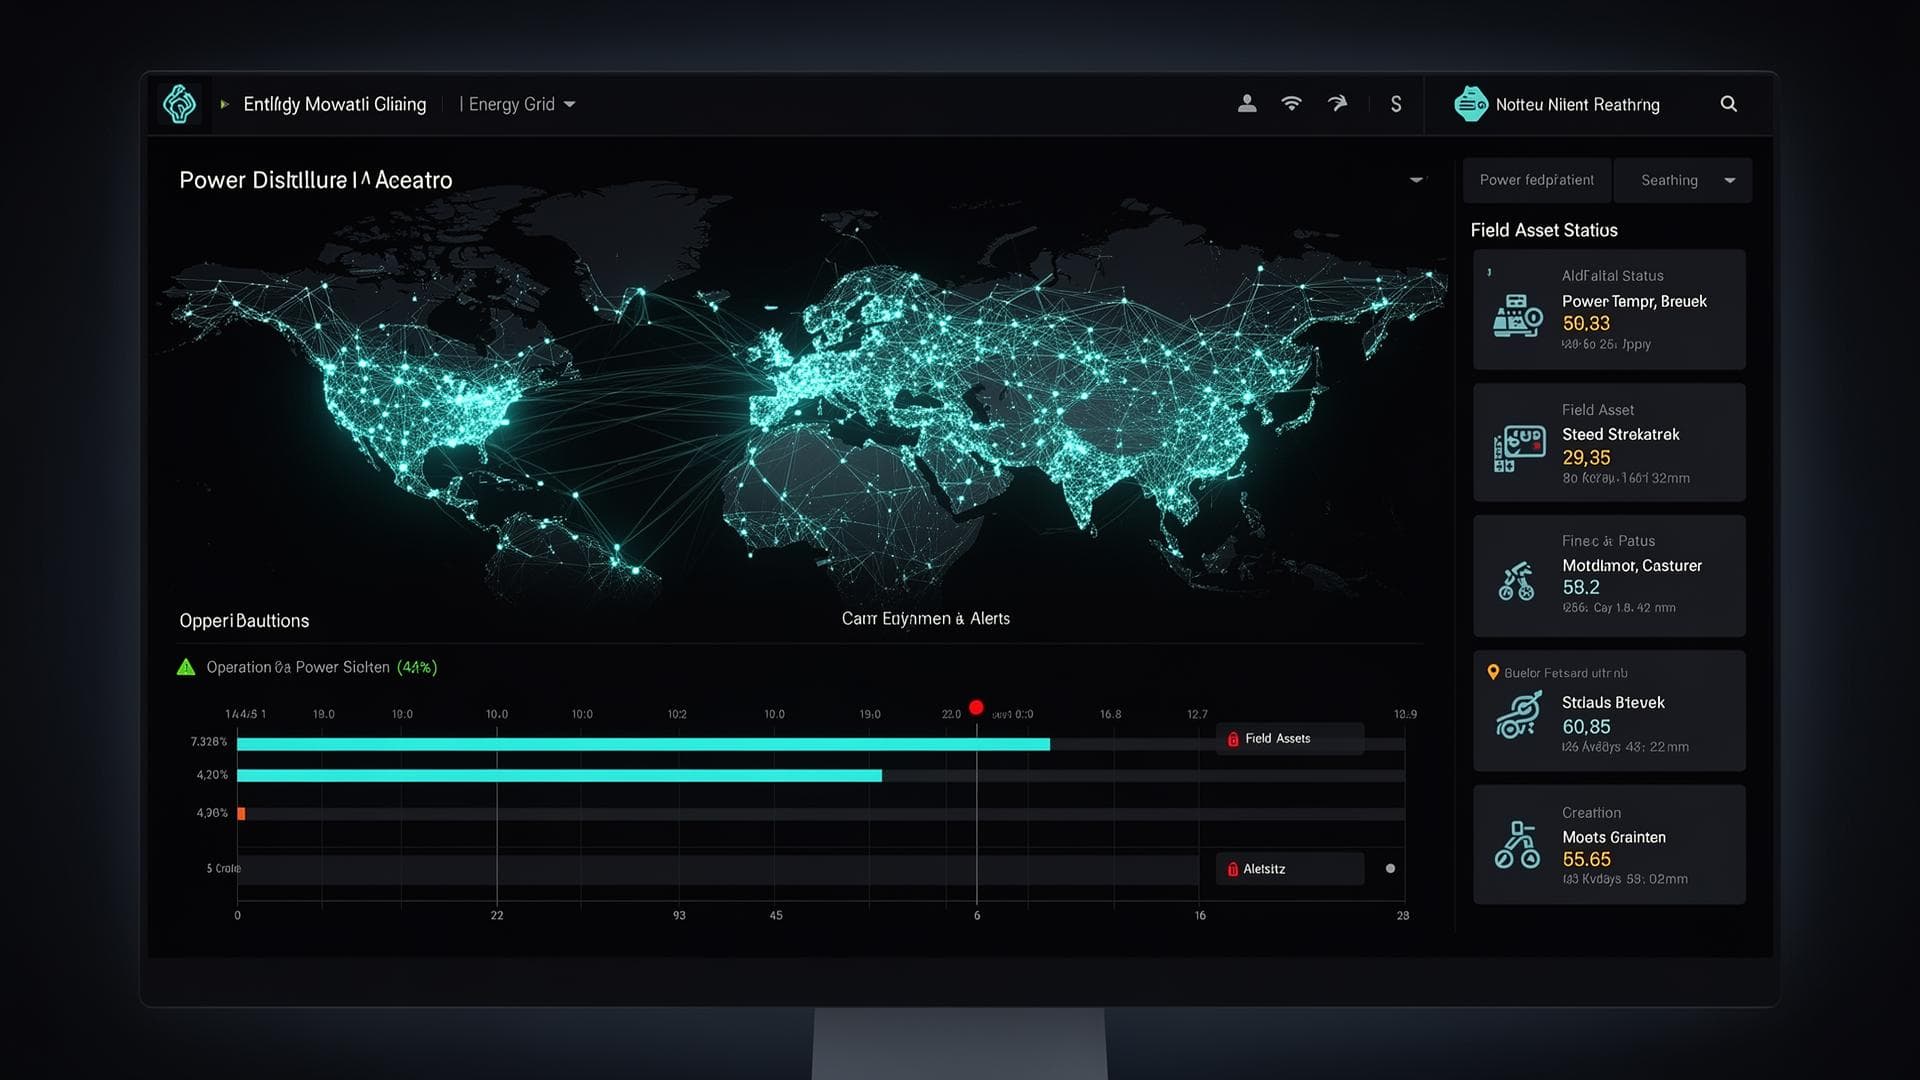
The system demonstrates field readings appearing as alerts and a time-ordered incident record for operators to review.
Connected field telemetry, rule evaluation, alerts, and an operator-facing incident view.Related services
From Rodent Lab Insights
Build something similar
Tell Rodent about the operational problem, users and constraints—not just the technology you think you need.